
Using the Interactive Reports
So where should you get started with the interactive reports? Why are there three different sets of reports, and which should you use? It helps to break down what granularity is.
What is Granularity?
Generically, granularity is a data analytics term that basically refers to how close or far away of a look at the data you have. In a business context, think about if you were looking at sales of a product. You could look at sales by year to see year-over-year numbers, but you could also go deeper and look at sales by month or even day.
Here’s a great, brief breakdown of the term from Dremio.
In the context of this site, it means how closely we can analyze and filter NPB stats. There are three ‘layers’ of granularity you can choose from – Season, Game, and Plate Appearance (PA).
Season-Level
Season reports can break data down by year/season, so you can quickly see how players performed on a yearly basis. This would be the “sales by year” level if we’re thinking back to the business context. This is the furthest away from the data we get, but you can still accomplish a lot here. You can break down the data by player attributes, such as how all left-handed batters performed, compare all catchers to each other, see how everyone under 30 is doing, and even see how players who went to your school did.
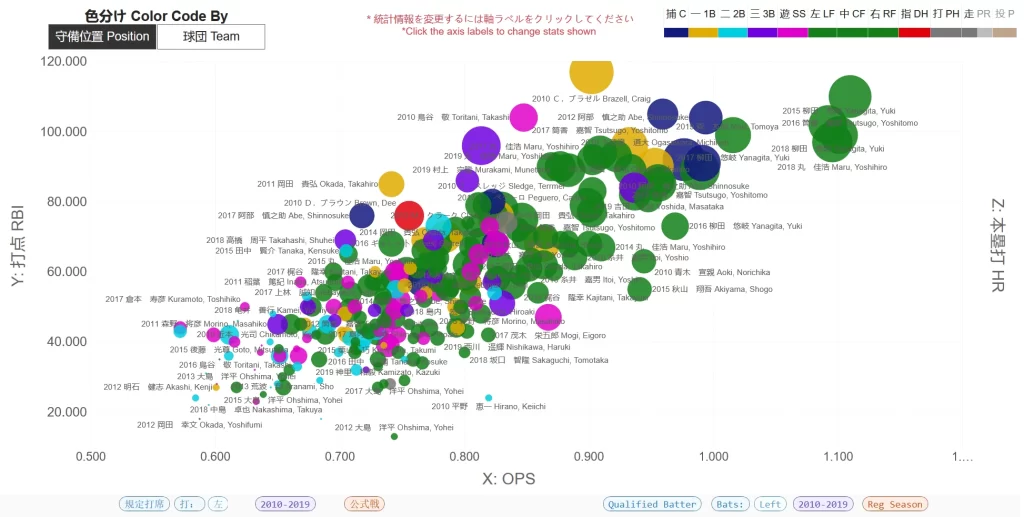
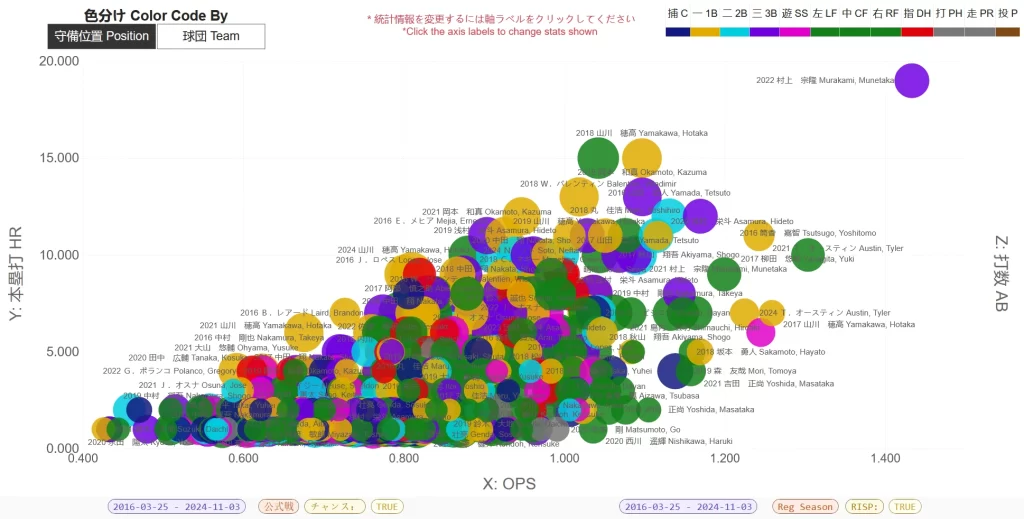
Here’s a quick example of something we can do here. This is from the Season/Series Granularity – Multi Player/Team Lookup report.
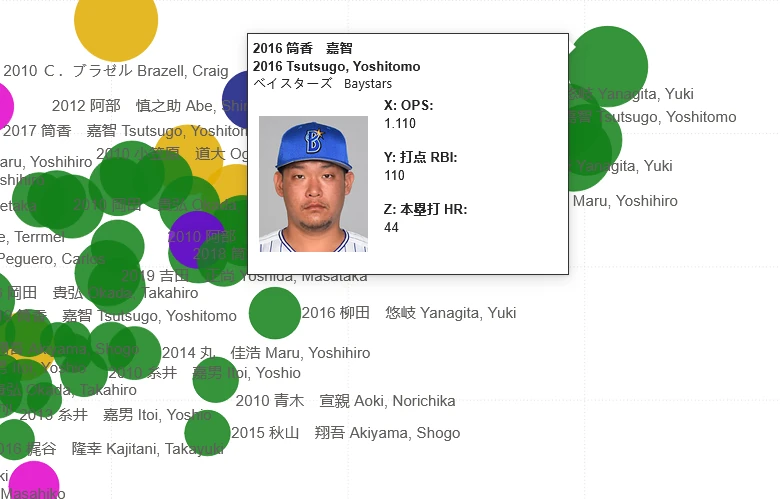
Looking at the bottom-right you can see how we’re breaking out, or filtering, the data. We’re looking at the regular season at all qualified, left-handed batters from the 2010s. We’re then charting them by OPS and RBI (sizing by Home Runs) to see what players had the best seasons.
You cannot, however, see how a player performed in a particular month or against a particular team in the season granularity reports. If you’re wanting to see how everyone performed month-to-month, post-All Star Break, or day-to-day, you need to go closer to the game granularity reports.
Game-Level
The game granularity reports, as the name implies, means we are looking at the data, but with the ability to break it down by game-specific contexts. This opens up a ton of capabilities to visualize and filter the data. You can look at how everyone performed in a particular month, day of the week, against certain teams, at certain ballparks, and even only look at games where certain player specific metrics were met (e.g. “only looking at games where a home run was hit”).
The below is from the Game Granularity – Multi Player/Team Lookup report. This time we’re doing something a bit more unique. We’re still applying some filters that we could also apply at the season-level, but we’re also adding in some things that we need data on specific games to do.
The below plots all right-handed pitchers from the 2010s post-All Star Break by ERA, Earned Runs, and sized by the number of innings. Also note at the top that we’ve applied a filter specific to the chart to only show pitchers who pitched minimum 60 innings post-All Star Break.
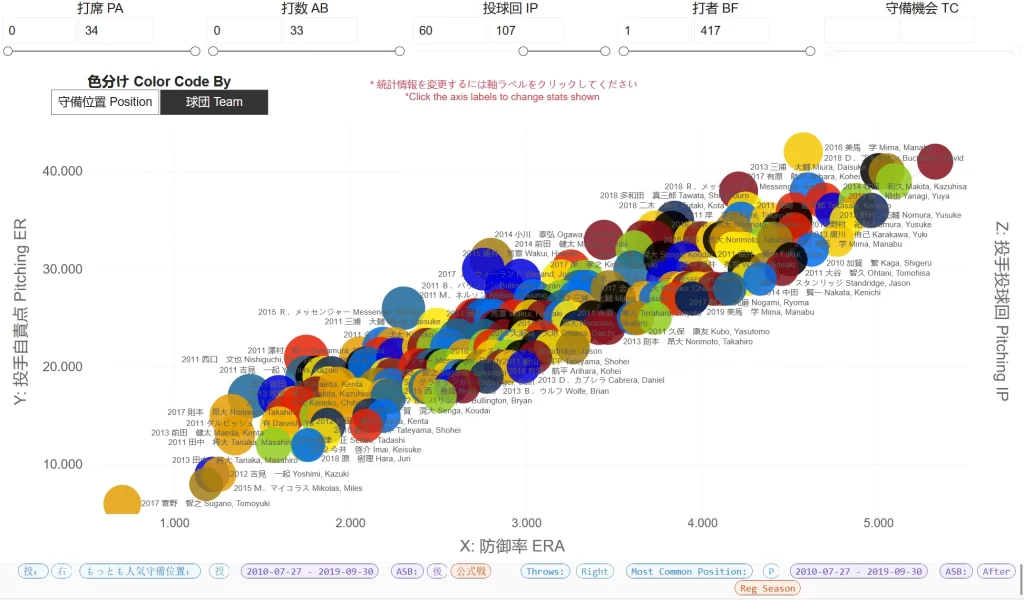
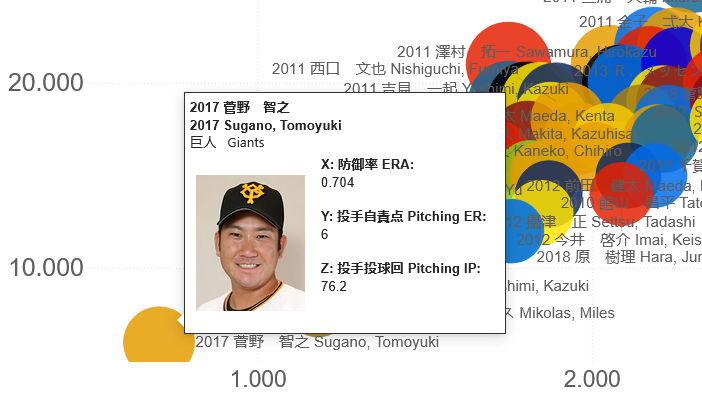
Plate Appearance Level
Getting even closer to the data we can go inside of the game and filter by specific in-game contexts. What pitcher performs best when there are already runners in scoring position? What batter comes through on full-counts? You can answer these questions here.
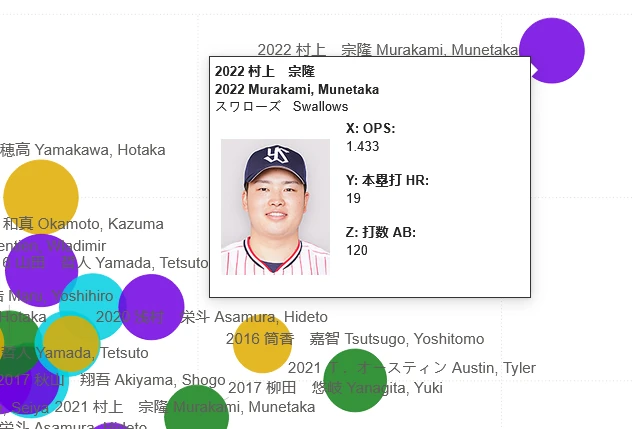
Below we’re looking at the PA Granularity – Multi Player/Team Lookup 2016-2024 seasons to see who hit the most home runs and had the best OPS when runners were in scoring position.
So Why Even Bother with some of the reports?
The answer depends on what you’re trying to do. If you’re just doing basic season-level things, then the season-level reports are going to be the fastest and easiest to use. There’s less number crunching in the background when you’re comparing hundreds or potentially thousands of players against each other.
There are other reasons though, and it comes into play more if you’re looking at older seasons.
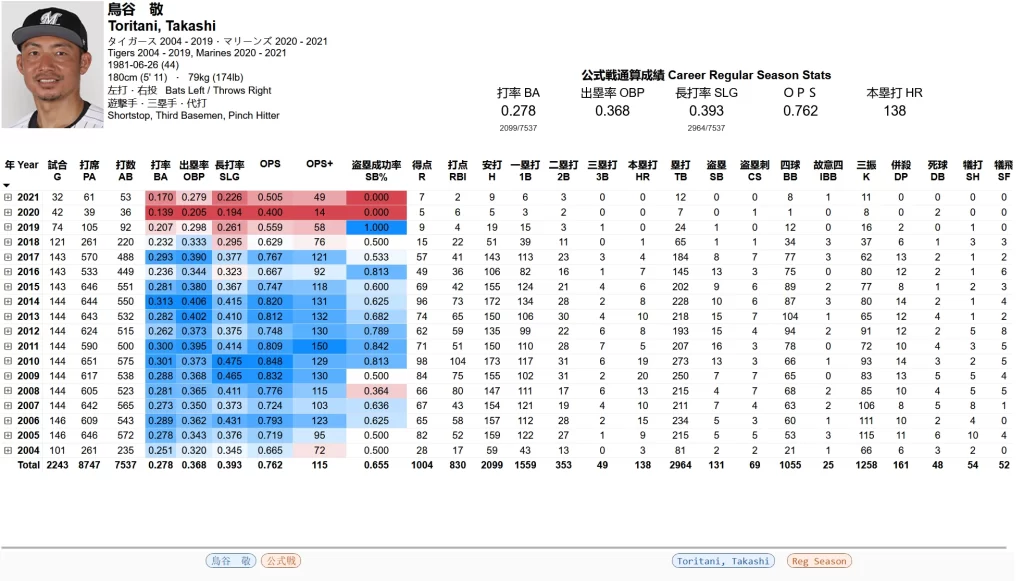
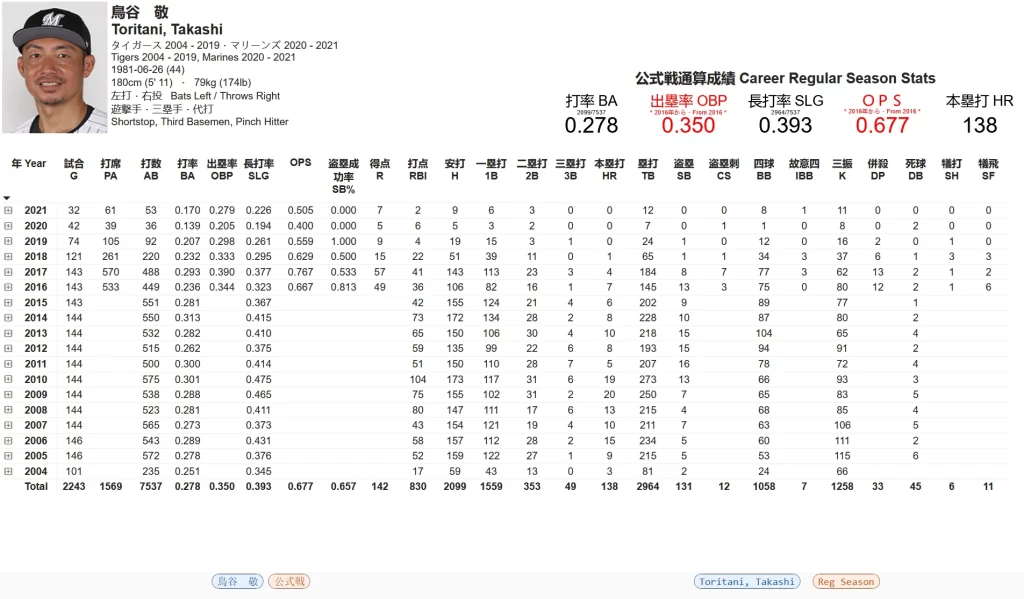
Below are the player lookup reports at the three levels of granularity for the now retired Toritani Takashi.
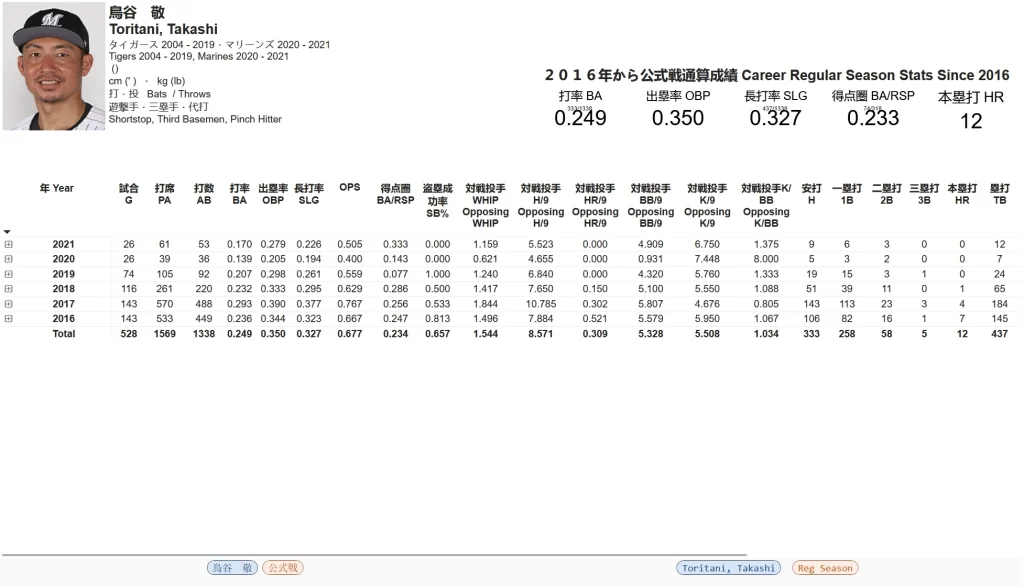
The difference between the levels is the availability of particular data points.
Let’s start with comparing the Season and Plate Appearance levels.
The most apparent you’ll see is that, despite Toritani playing from the 2004 season until 2021, the Plate Appearance level report only shows from 2016.
You cannot go before 2016 at the Plate Appearance level, we only have the data to do so from 2016 on.
In addition, you’ll notice that while we have stats unique to the Plate Appearance level (e.g. BA/RSP, pitcher performance against Toritani, etc.), we’re also missing some stats that we do have at the Season level (Runs, RBIs, etc.).
Unfortunately, the way the NPB provides play by play information for each game does not allow us to reliably determine some of those stats.
Good news here is that it should be obvious, the report will not allow you to view anything prior to 2016 and if a stat is unavailable you simply won’t see it.
Next let’s compare the Season and Game levels.
These reports look a lot more similar to each other on first glance, and you’ll see all of the same stats (R, RBI, etc.) in both.
However, and hopefully the screenshot makes it obvious, not all years have information for all the available stats.
Note the Runs column in both reports. The season level has that information for every year and Toritani’s total runs add up to 1,004. This is correct, Toritani has 1,004 career total runs in the regular season.
However, data on runs is not available prior to 2016. Unfortunately NPB has not made that information readily available prior to 2016. However, the report still shows this column as there are years where we do have that information.
Another example of this missing data is a bit harder to spot. Look at column DB. We have the same data for every year except 2004 for Toritani. Some data is not available before 2005.
Why 2005? That’s the first season where the newly formed Rakuten Golden Eagles and merged Orix/Kintetsu Buffaloes began play, and NPB apparently took the opportunity to provide some more stats for us from then on.
Bottom-line, be careful in the game level reports if you’re looking at seasons prior to 2016 and especially prior to 2005. The game-level reports DO allow you to view that information, but in some instances it is incomplete and the totals and percentages may be misleading.
Verify if all the data is there by looking at some of the available tables and expanding the years to see if you see blanks.
And that’s all there is to it! Please reach out if anything is unclear and I’m more than happy to help out!